
Uptime Kuma: The Monitoring Tool That Actually Makes Sense
2 years, zero maintenance - the monitoring tool that just works, but not for everyone

GitHub repo: https://github.com/louislam/uptime-kuma
Live demo: https://uptime.kuma.pet/

Why Most Monitoring Tools Suck
Let's be honest - most monitoring solutions are either enterprise monsters that require a expertise to configure, or they're SaaS products that cost more than your coffee budget. Uptime Kuma is a self-hosted monitoring tool that does exactly what you need without the complexity headache.
Here's what makes it special: you can have it running and monitoring your services in under 10 minutes. The interface is clean, the documentation actually makes sense, and it won't eat your server resources alive.
I discovered Uptime Kuma through this video when I was frustrated with overcomplicated alternatives, and it immediately solved my monitoring problems.
Real-World Use Cases
Home Lab Enthusiasts
Monitor your Raspberry Pi projects, NAS devices, and home servers. Perfect for tracking when your remote house loses power or internet connectivity.
Small Business Owners
Keep tabs on your e-commerce site, payment processors, and customer-facing APIs. Get instant alerts when your online store goes down during peak hours.
Developers
Monitor client websites, development servers, and staging environments. Catch issues before your clients do.
Content Creators
Track your streaming services, CDN endpoints, and social media integrations. Know immediately when your audience can't access your content.
My Setup: Simple But Effective
I run Uptime Kuma on two devices:
Raspberry Pi in my homelab at a remote house
Small VPS in the cloud (256MB RAM)
The monitoring logic is straightforward:
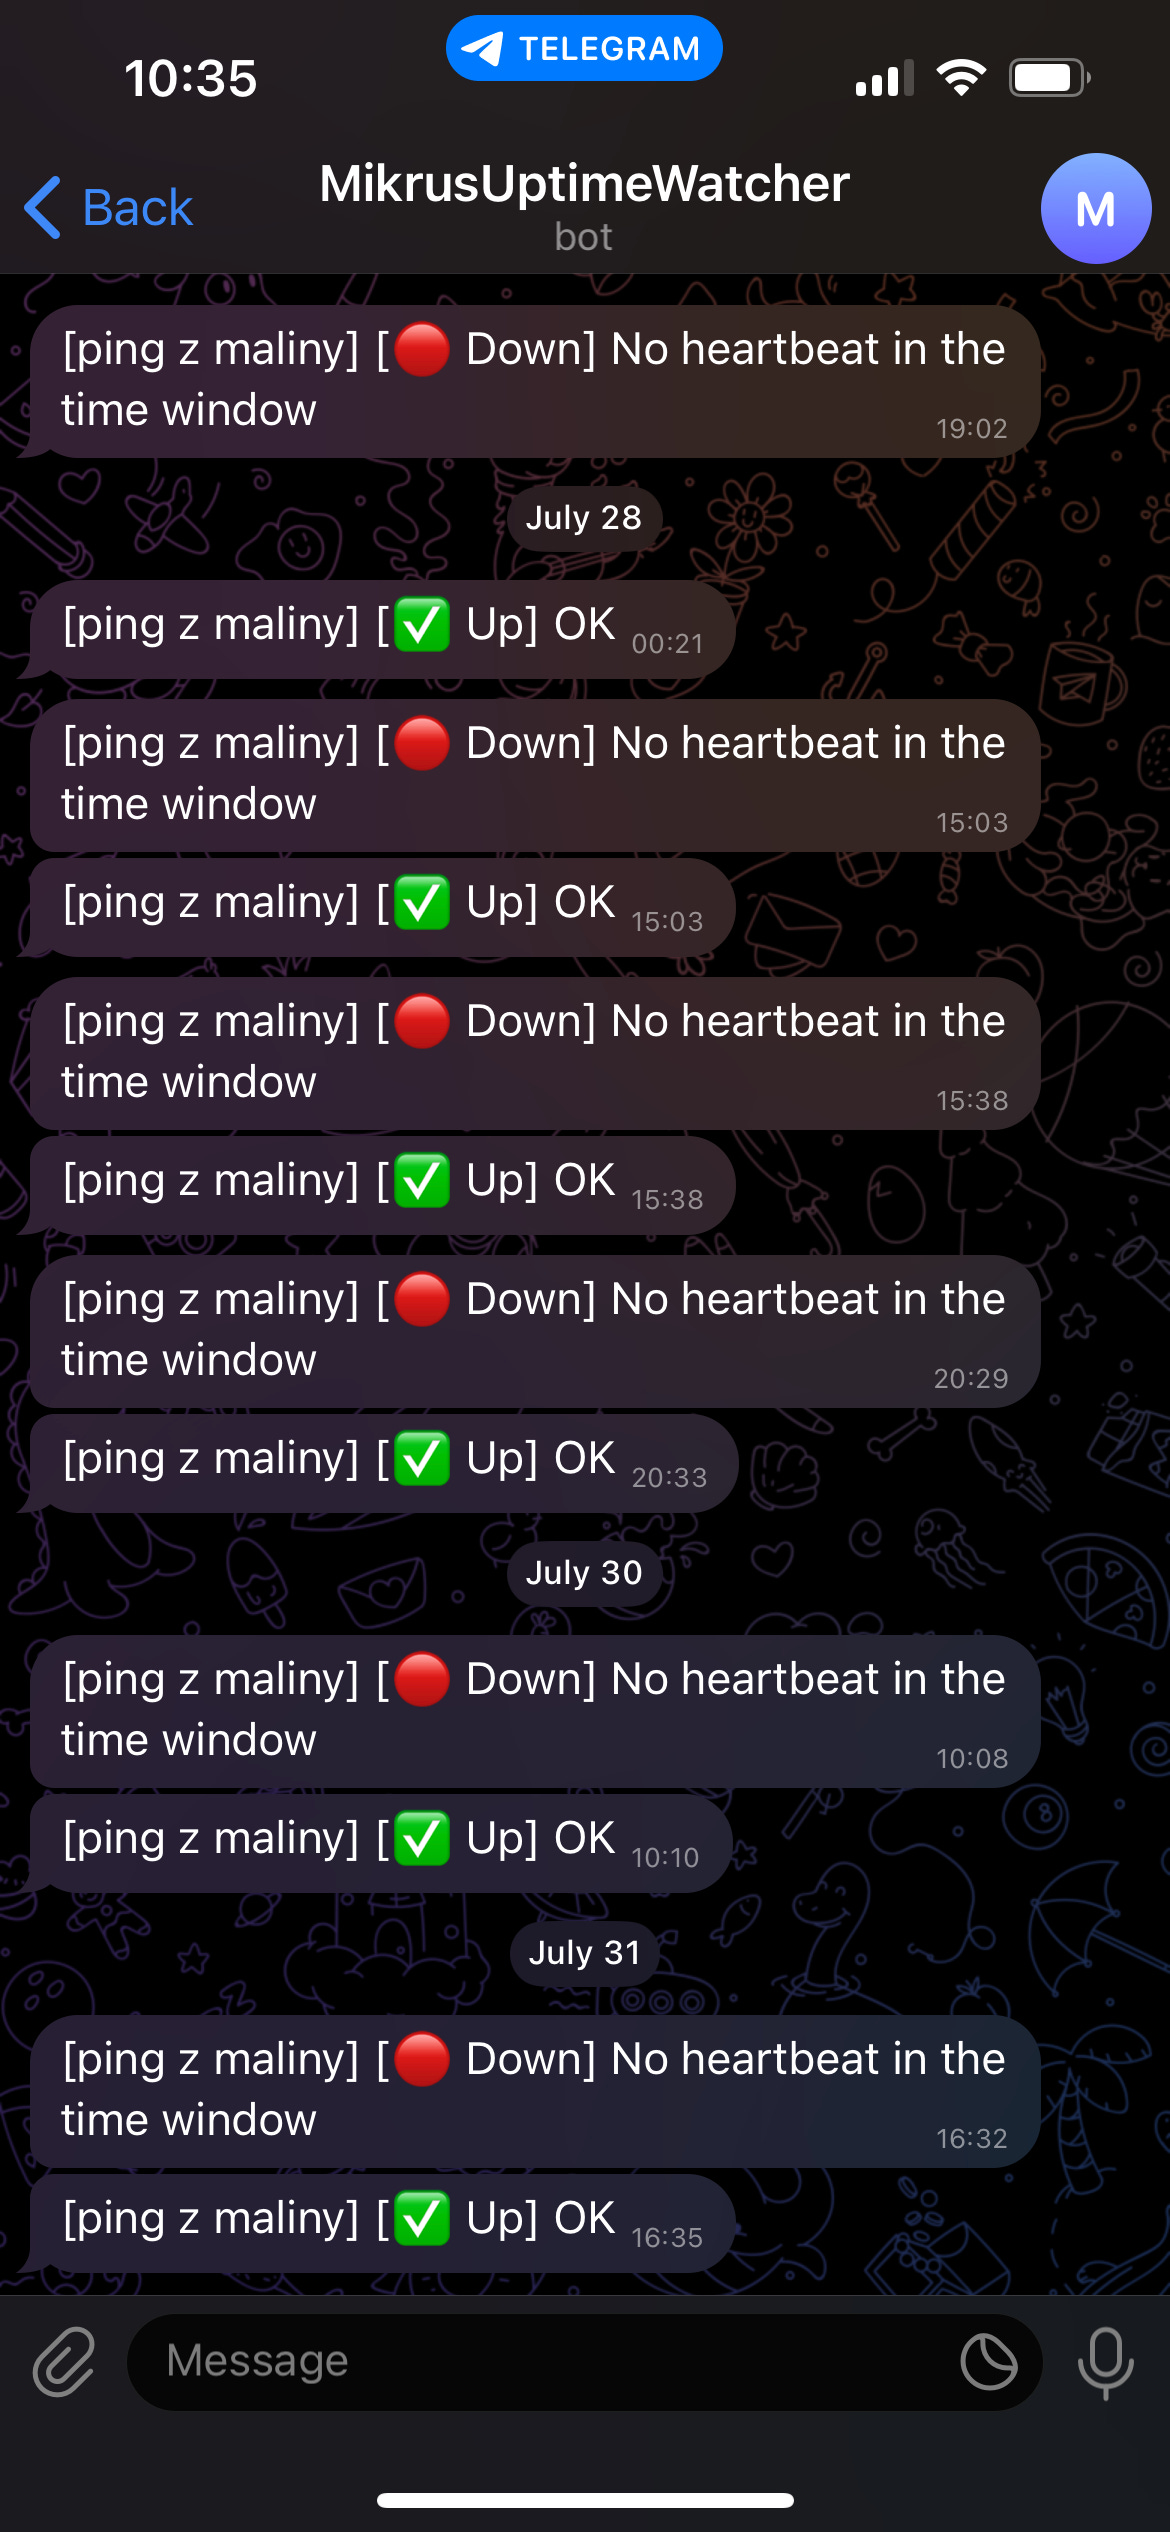
Heartbeat System: My Raspberry Pi sends a "heartbeat" ping every 60 seconds to my VPS
Failure Detection: If the VPS doesn't receive 3 consecutive heartbeats (3 minutes), it triggers an alert
Instant Notifications: I get a Telegram message immediately when something goes wrong
Configuration Example
Here's exactly how I set up the heartbeat monitoring:
# docker run command for VPS
docker run -d \
	--restart=always \
	-p 8081:3001 \
	-v data:/app/data \
	-v /var/run/docker.sock:/var/run/docker.sock \
	--name uptime-kuma louislam/uptime-kuma:1
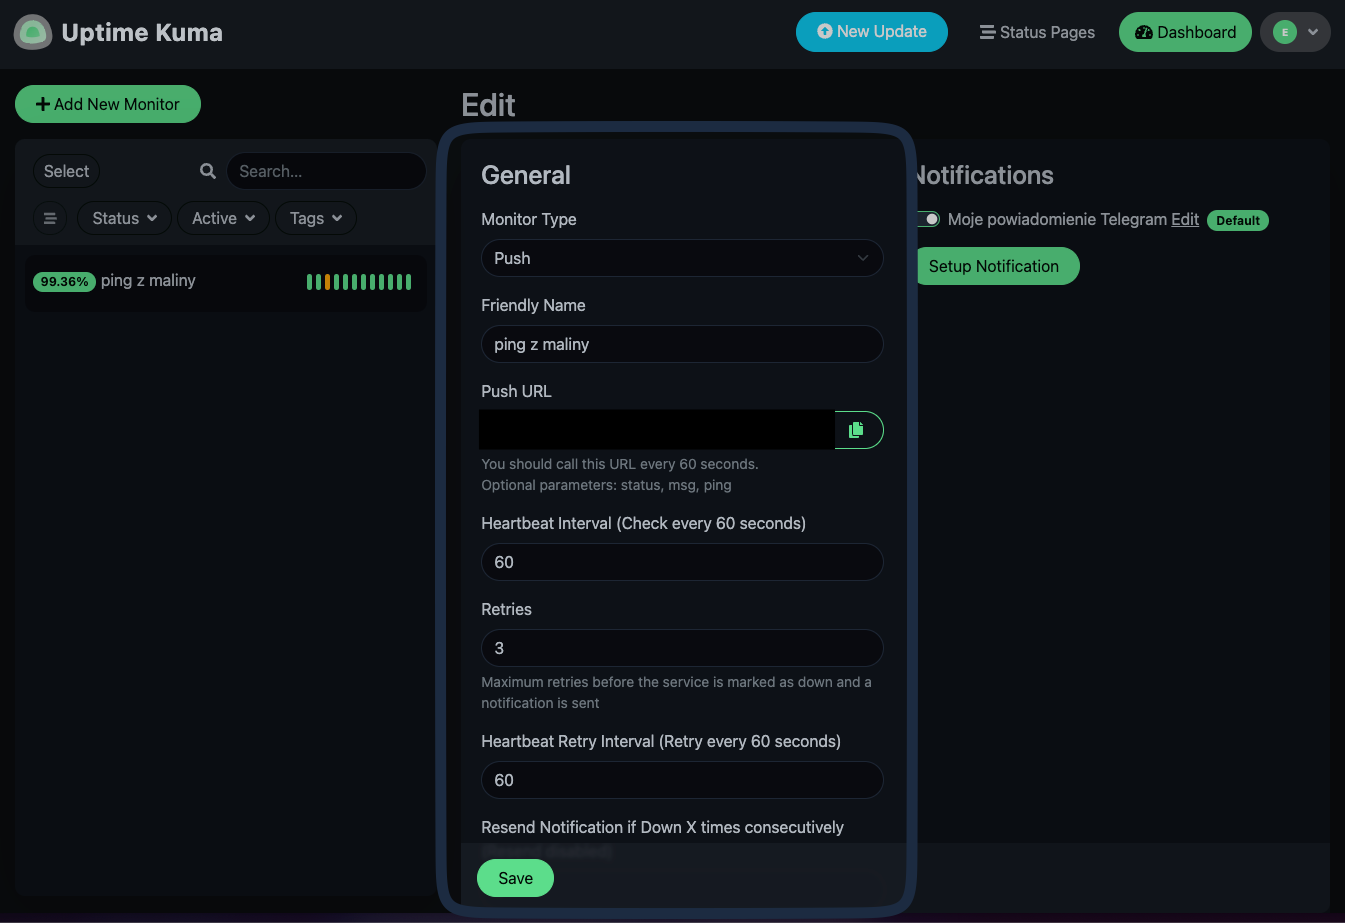
Monitor Configuration:
Monitor Type: Push (for receiving heartbeats)
Heartbeat Interval: 60 seconds
Retries: 3
Heartbeat Retry Interval: 60 seconds
Telegram Setup:
Create a bot via @BotFather
Get your bot token and chat ID
Add them to Uptime Kuma's notification settings
Performance
The beauty of this setup? It works flawlessly on my tiny VPS with only 256MB RAM (currently using 170MB total with just this service running). CPU usage is practically zero - the process barely registers on system monitoring.
Why Uptime Kuma Beats the Competition for Regular Users
Nagios/Zabbix: Powerful but overkill. You'll spend weeks learning configuration files.
Datadog/New Relic: Great features, terrible pricing. Your monitoring costs shouldn't exceed your hosting costs.
Uptime Kuma wins because:
5-minute setup: Seriously, you can have it monitoring something in 5 minutes
Human-readable documentation
Resource efficient: Runs on a potato and doesn't complain
One-time time investment: Host it yourself, pay nothing monthly
Visual feedback: The interface actually shows you what's happening at a glance
Who should look for different tool
Uptime Kuma is not for everyone. It is best suited to individuals and small teams with moderate monitoring needs who value open-source, self-hosted solutions.
Key groups for whom Uptime Kuma is not suitable:
Large teams with very large-scale infrastructure
Automation-heavy DevOps operations
Environments requiring high reliability and redundancy
For those groups I suggest using tools such as Nagios, Zabbix, Datadog,New Relic.
Advanced Monitoring Capabilities
Uptime Kuma can handle sophisticated monitoring:
Keyword Detection: Monitor if specific text appears (or disappears) from web pages
JSON API Monitoring: Check API responses and validate JSON structure
Port Monitoring: TCP port availability checks
Docker Container Health: Track container status and resource usage
Get Started
Quick Installation Guide: Complete Docker setup tutorial
What to monitor first:
Your main website/application
Critical API endpoints
Pro tip: Start with just 2-3 monitors. It's better to have reliable monitoring of critical services than overwhelming alerts for everything.
What's the most critical service in your setup that you should be monitoring? What tool do you use for monitoring?